Showing posts with label Statistics. Show all posts

Thursday, March 8, 2018

So how many licks...?

Everyone knows the famous question that's plagued children and adults for millenia...

How many licks does it take to get to the tootsie center of a Tootsie Pop?


One of my absolute favorite lessons in AP Statistics was the Tootsie Pop Lab. This lab emphasizes how to estimate the ACTUAL average amount of licks it takes to get to the center. Will this question ever be answered!? Non-Statisticians would tell you "nah", but the real Statisticians would use inference mathematics. In this realm, we can get pretty close to the actual answer by providing a range of possible answers that could be true - what Statisticians call a Confidence Interval.  

A big idea running through the veins of Statistics is the idea of an unknown parameter - the ACTUAL population value. Example questions we could answer that have these unknown parameters would be...

  1. What proportion of the world is covered in water?
  2. What is the average life expectancy in the United States?
  3. What is the average number of books teens read?

Clearly they were into it!
Clearly, it would be a challenge to find the ACTUAL percentage of the world covered in water or the actual average life expectancy, but we can get reallllllly close by taking sample measurements and drawing conclusions from there - i.e. finding a statistic! 

In Statistics, it's about getting on the dart board - not the bull's eye!


This lab teaches students this very idea! We may never really know the answer, and THAT'S OKAY! Using inference to draw conclusions is what mathematics can yield - and even better, we can provide plausible answers! It's a rare glimpse into the power and insight that only mathematics can provide. 

Activity: Tootsie Pop Lab

Essential Question: 

How can I estimate the true average amount of licks it takes to get to the center of a Tootsie Pop?

Materials:

  • Tootsie Pop Presentation - Google Slides (click Use Template for your own copy!)
  • Tootsie Pop Analysis - Padlet (click Remake if you want to use it!)
  • Student Notes - Google Sheet (click [Make a Copy] and now it's in your Drive!)
  • Flipgrid - create 1 topic in Flipgrid where students can post their reflection asnwers
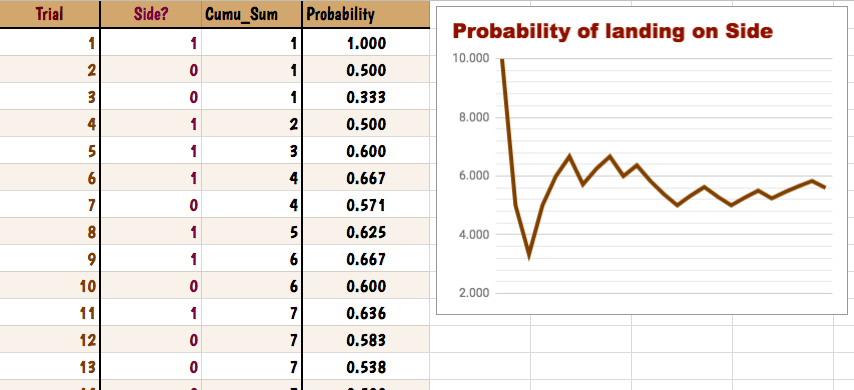
Possible Student Google Sheet

Provide students with the directions about licking their lollipop and remind them to lick in the SAME SPOT. You'd be surprised how into it your students get. I recommend putting them in partners, especially if you have a student who doesn't like lollipops.

As students begin to find their center, have each student enter in their number of licks on the Google Sheet. I highly recommend using Google Classroom to help you share information with students. You'll be sharing the Sheet, Flipgrid, and Padlet with them.
Teacher Presentation (other slides included)

PRO TIP
: In Google Sheets, type "=" to get the formulas to work. For example, "=average(...)" and then students can select all the trials at once. It works similarly for the others.

Take-Aways:

  • The "homework" for the evening is not practice problems at all! It's all about reflecting on what they discovered in class. Students recalled previous information to see how it fits in to their new content.
  • Students LOVE candy (surprised about that?)
  • Students enjoyed working with REAL DATA! It's not made-up numbers from a textbook or internet. It was personal. They were the data.
  • Putting them in partners helped them find formulas in Google Sheets quickly and allowed them to process their ideas out loud.
  • Why I used Padlet: helps students collaborate all at once in an easy way. Students can add voice notes, drawings, text, links, and photos for everyone in the class to see. This allows students to express their learning in a variety of ways that best fits them.
  • Why I use Flipgrid: Students can post their reflection questions after the lessons and hopefully hear from other students. This way, students can respond to each others questions and really utilize peer feedback. This develops a community in the classroom, because we are all learning together.

Interested in the answer my students found? Check it out!

Before my district had Chromebooks for every student, I used Fathom to gather all of the data from my classes last year. Here is what we've discovered!

My students were really surprised that both classes had an average close to 330 licks.

Our Class Average amount of licks: 333.629 licks

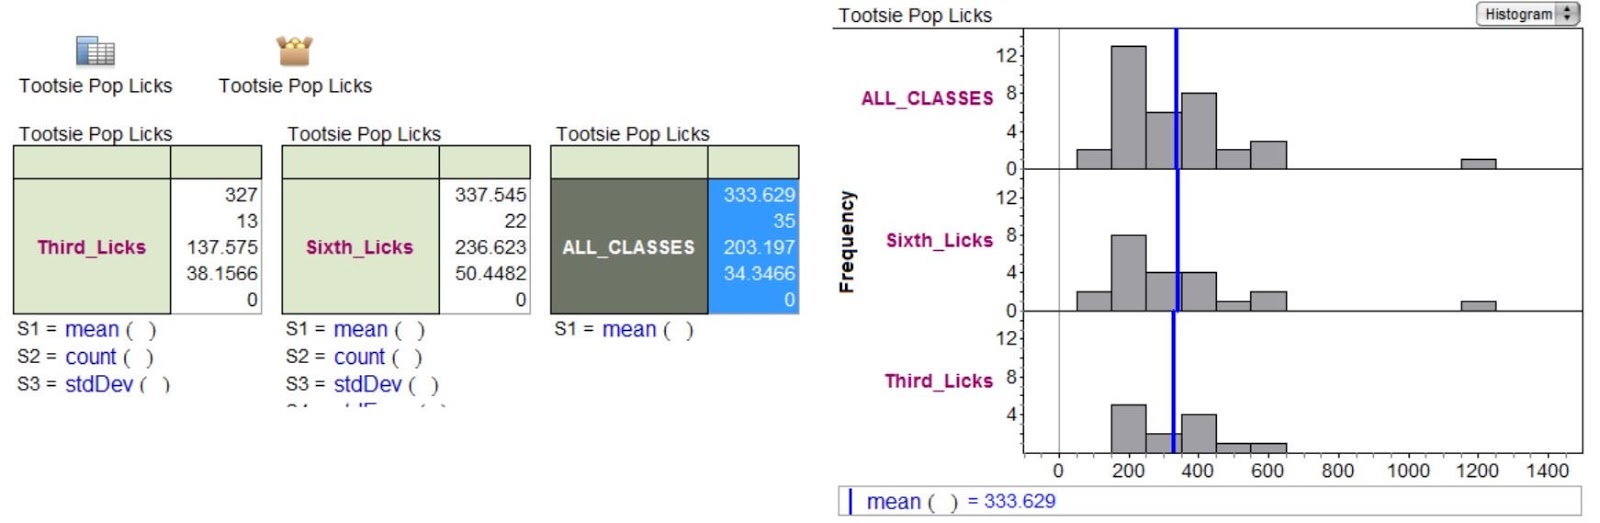
My Class Data (2016)


Friday, February 23, 2018

Taking a Chance!


Taking a chance on lessons can bring about anxiety...even more so when it's a concept that students struggle with based on your experience. This is how I felt constantly when teaching probability.

Probability is not just the science of chance but also the science of overthinking - at least in my students' eyes. They could understand visually what was occurring, but throw in expected value, standard deviations, random variables, and the eyes begin to aggrandize.

Instead of fighting the uphill battle of "why use these formulas" and the "why did you subtract from 1?" questions, I chose a different approach and created an activity going back to the probability basics - throwing some die around and making some "money".

Sample Student Work

Activity: Bunko! 

Rules of the Game: Bunko is a game of 3 colored die. Based on what the students roll, you could receive "money". Assume that the die are fair.
  • If you roll the dice and end up with exactly one die showing a “1”, you win $1.00.
  • If exactly two dice show a “1”, you win $2.00.
  • If all three dice show a “1”, you win $21.00.
  • If all three dice show the same number (any number from 2 to 6) you win $5.00.
  • Any other outcome results in $0.00
Materials:
  • Activity: Bunko - Google Sheet (1 per student)
  • Activity: Bunko - Google Slides (1 per student)
  • Use this handout if your devices are limited (1 per student)
Concepts Addressed:
  • Expected Value/weighted averages
  • Combining Random Variables (multiple games)
  • Law of Large Numbers
Student Directions:
  1. Play 30 rounds of Bunko, recording your answers on the Google Sheet.
  2. Determine how much money you would win and record it. Watch your counts begin to fill in!
  3. Open the Google Slides and begin answering your questions.
  4. Gather all the CLASS data and enter that on your 2nd Tab. You will watch the class counts fill in!
  5. Create a graphical display of the class data for your Google Slides.
  6. Go to the Google Slides and answer the remaining questions with a partner.
Teacher Prep: Assign the Google Sheet and Google Slides through Google Classroom where "each student gets a copy."
Student's Google Slides! Don't have Google Classroom? Change the link from ".../edit" to ".../copy" and share it with them.

TakeTake-Aways:
Even though throwing dice can seem trivial, students surprised me by getting so excited! They grasped the concepts at a deeper level and performed stronger on their quiz. Perhaps sharing candy for students who had the most amount of money, least amount of money, and which student had the most significant counts??

At the end, they would want to play more games and determine further probabilities! I used this idea and created a probability game day, where they gathered the experimental probabilities and calculated the theoretical probabilities at home. 

Possible Extension for AP Students: Have students run a chi-squared goodness of fit to determine if their individual data was significant using the theoretical probabilities they made on the handout.

Overall, I was thrilled to take a chance and have the students play a game rather than going through additional examples from their textbook. They were more engaged, required to think critically and make connections, and most importantly, they developed a stronger foundation of probability that made the rest of the unit smoother.


Friday, February 9, 2018

Chocolate-y stress in Math

After attending TCEA in Austin recently, I wanted to create a post about going digital in the math classroom, thanks to Amanda! In this post, I'd like to focus on the stress and anxiety that math can induce in students. Jo Boaler, an amazing educator who focuses on mindsets in mathematics, stresses (pun intended) that...

"When students get the idea they cannot do math, they often maintain a negative relationship with mathematics throughout the rest of their lives...the idea that math is a "gift" is responsible for much of the widespread math failure in the world."


My question is, so how can we encourage students to maintain a growth mindset in maths and how to create a class environment that is geared towards helping them achieve this? One way that I hope to answer this is share some lessons that had students arrive at different answers and that our final conclusion in class was THAT THIS IS OKAY! Jo wants students to see the creative and interpretive nature of mathematics, and I think an example lesson will help.

One of my favorite lesson styles is utilizing the 5E lesson model, where inquiry is at the heart of lesson. I think this is one of the best ways to encourage all students to interact with math and alleviates some of the apprehension students face. The lesson below will outline this style and materials are included at the very bottom if you're interested! You will need a Hershey Kiss for every student (why not help relieve stress in math by using a little chocolate???)

Title: Chocolate-y Odds

Essential Question: How can I determine the odds of a Hershey Kiss landing on it's side?

Audience: Statistics, Probability, Math Models and Applications, Geometry

Engage:


  1. Break students into group of 2-3 people. 
  2. Have students make predictions about what the odds are of a Hershey Kiss landing on it's side. Record their answers on a Mentimeter to gather the their thoughts quicker. 
  3. Sample Mentimeter
  4. Have students share out how they made their prediction. Consider how the Hershey Kiss is shaped and compare it to a coin.

Explore:

  1. Provide students with this Google Sheet so that they can record their data. Use a "1" if the Kiss lands on it's side and a "0" if it's on it's bottom. This can be done with their group. 
  2. Have students calculate the Cumulative Sum using Google Sheets. Example: if I want to add Cell B2 to B4, type "=sum(B2:B4)". If students don't want to type it, they can click and drag all the cells they want.
An Example of a final product!

  1. Have students calculate the probabilities with each step by dividing the cumulative sum by the trial number. Example: "=C3/C1" in the cell
  2. TIP: Google Sheets will start to PREDICT the formula if you keep using it over and over again! Simply click the "blue box" next to the cell and drag it all the way down! 
    The "blue box" is in the lower RIGHT corner
  3. Finally, have the students create a LINE GRAPH of their probabilities. Steps are included on the Google Sheet if you have students finish the sums early.

Explanation:

  1. Have students open the Google Slides. TIP: Share the Slides in Google Classroom by choosing "Students can Edit". 
    "Team Response" Slide
  2. Students to add the slide "Team Response" to the presentation. 
  3. Each partner/group will add their Probabilities Line Graph to the Google Slide and answer the questions with their team based on their graph.
  4. If students are finished early, have them go to another group's slide and provide some feedback, like a Bitmoji
  5. Click [Present] and go through each group's line graph. As you look through each one, have each team write down some observations on a Mentimeter. All students deserve a VOICE! We are in 2018, people!
  6. Choose Open-Ended on Mentimeter!
  7. Hopefully one of the observations between all the graphs is that the more times students tossed the Kiss, the line graph gets closer to a number!

CONGRATS, you've introduced the Law of Large Numbers/Kisses.

Elaborate:

  1. Have students interpret what it means when a coin is "50/50" using the Law of Large Numbers.
  2. Provide the example of the coin again. Ask, "If I keep getting tails over and over again, am I MORE LIKELY to get heads?" 
  3. Introduce the idea of independence - each toss doesn't affect the next one. The odds are ALWAYS 50/50 with each toss.
  4. Introduce that we are never "due" to get an outcome. This is called the Law of Averages and IS NOT TRUE.

Evaluate: 

Students find an object at home and toss it (not breakable, duh!) and create another line graph and share it on another Google Slides presentation. Open these up the next day and students can share their findings and how the Law of Large Numbers relates.

Extra Materials:


  • Teaching AP Statistics or Science: Designing Chocolate (Google Slides) - Experimental Design
    • TIP: If you're sharing in Google Classroom, choose "Students can Edit" so that everyone is on the same slides.
    • This is PERFECT if you teach AP Statistics to help students understand how to set up a proper experimental design.
  • Aren't 1:1 yet or have the devices you need? Here is a worksheet using the TI-84 Calculator instead!
  • Teaching AP Statistics? Use this data again to have students create confidence intervals! Use this worksheet if you'd like as a resource! I haven't made this digital...yet ;)

Interested in making Math more digital? Check out my Session Notes from the TCEA conference in Austin, Texas.

Wednesday, January 24, 2018

"Spreading" the Word

For this entry, I would like to "spread" the word about utilizing Google Sheets in any math course that has students measuring data. For me, it was in my Statistics course. It's a powerful tool that not just allows students to enter data but to analyze it in a way that communicates a story. In Statistics, my biggest push for students was to reach beyond the numbers and include some juicy context in their solutions.

If a student shared out an answer of "10" with eagerness, I would give a warm smile and then probe his answer...

"10? Do you mean 10 squirrels? 10 cakes? 10 Jacobs? What's the 10 mean?!" 


I would get a pause from, let's call the student Jacob, and would encourage a more exact answer that is more meaningful. A number is meaningless without context to give it meaning. 

I created this lesson for an AP Statistics course to review not only Chi-Squared Goodness of Fit tests, but also as an introduction into Google Sheets. If you're just wanting the Google Sheets, feel free to snag just that!

Lesson: Intro to Google Sheets

Essential Question: 

How can I utilize Google Sheets to create a meaningful analysis of data?

Materials:

I Do (sorta...not really): This lesson involves students in every phase.

Begin class with students filling out a Google Form so that you can use real data in the activity. While they're filling out their answers, start this absolutely hilarious video clip from "That 70's Show" where a father and son are having a brief...misunderstanding?...of Statistics. Feel free to emphasize the importance of communication in any math course. 

We Do: 

When you're ready, share the "Responses" sheet from the Form with students so that everyone gets a copy using Google Classroom or by changing the sheet URL to ".../copy" instead of ".../edit". Students will open the "Google Sheets 101" reference guide. Walk through the following with students:

  1. Creating a graphical display (pie chart, histogram, bar chart)
  2. Calculating summary statistics (average, median, standard deviation, quartiles, min, and max)
  3. Apply conditional formatting to highlight desired values
  4. Apply alternating colors so that the rows are more distinct (plus, who doesn't like a splash of color in their spreadsheets?

You Do: 

Provide each student with one bag of snack-sized Skittles. 
  1. Students will pour out their bag, organize by color, and then record their counts on a new tab on the same Google Sheet. 
  2. Share "Statistical Rainbow" with the students via Google Classroom where "all students can edit". This activity is a collaborative so that students can comment on other's slides when they are finished adding their own. 
  3. Students will create two slides (which are templates already made).
  4. Click [Present] when you are ready to go over it as a class! Add comments to their slides later.

Other resources I used:


  • Canva to make the backgrounds for my Google Slides. Use the 16:9 dimensions in Canva to make sure it fits perfectly!!

Thursday, December 28, 2017

But I "regress"...

There are some specific mathematics courses that I have enjoyed teaching. To provide some background, I have taught the following in the last 6 years:
  • ESL Algebra 1 - 1 year
  • ESL Geometry - 2 years
  • On-Level Geometry - 1 year
  • PreAP Geometry - 2 years
  • PreAP Algebra 2 - 3 years
  • AP Statistics - 2 years
As you can determine, I taught multiple preps in various years. My ultimate favorite class has been AP Statistics. It's a branch of math that is similar to geometry in that there isn't anything like it! For my second post, I want to share out a theme in Statistics and how I have digitized it for a 1:1 classroom environment.

The lessons below are ways that I've allowed students to discover concepts in Statistics that have allowed them to process it in their own way and through the use of collaboration. AP Statistics is a unique course in that their AP exam emphasizes reasoning and communication beyond computation. They're graded on their explanations, whaaaa?!?!

99 percent of all statistics only tell 49 percent of the story.

In my course, I encouraged students to always keep in mind the "why" of the data. What's the story? What is the data trying to tell you, and are you interpreting it in the best way? How can you manipulate it? And even more importantly, how can people misuse this? In one of my units, I expand on their current knowledge of Best-Fit Lines (Least Squared Residual Lines). Students have seen scatterplots in previous courses, but do they really understand how to use them and what can affect their story, like those pesky outliers. 

Essential Question: How can I make predictions using a linear regression model, and how can outliers affect those predictions?

Digital Materials
  • Activity: Influential Points - link
    • Students compare types of outliers and discover what makes them influential. This activity requires a TI-84 Calculator or you could use Desmos.
    • There are extra instructions for students located in the "Speaker Notes" on each slide at the bottom.
  • Activity: Matching Scatterplots to Descriptions - link
    • Students determine the relationship between the strength and direction of a scatterplot and how it affects the correlation coefficient (r).
    • There are extra instructions for students located in the "Speaker Notes" on each slide at the bottom.
  • Various Activities (through Desmos) - link
    • Polygraph: Students partner up for quick 20-Questions style game. Encourages the use of statistical vocabulary.
    • Non-Linear: Students use Skittles to discover how to linearize a non-linear relationship. 
    • MUCH MORE!
I hope you enjoy the materials and that they find a place in your mathematical world. Follow me to learn more and reach out if I can help.

Thursday, December 14, 2017

Booting Up


As a newbie to the Blogger world, I've had trouble deciding how and what to write about, especially considering my mathematic's aptitude. However, I've discovered that I have two ultimate passions - mathematics and technology. Throughout this blog, I've received some strong advice from a friend (who is a more prolific writer than myself) - to create series of blogs!

First Series (and pun): Mathematics (with a technological dash)

This previous year, I was humbled to be named a State Finalist for the PAEMST award. After filling out the application, I realized how much I enjoyed utilizing technology in my classroom to enhance my students' learning, which I suppose leads to my current job as an Instructional Technology Specialist for my district home of 6 years. As a specialist, the hardest part can be aligning a felicitous technology tool with content, in particular mathematics. Therefore, why not include some sample lesson ideas, reflections, and when I picked a massive bouquet of whoopsie-daises?
Sample student work

For my highlighted lesson, I utilized GoFormative to help my students participate. Each pair of students shared a laptop and would take pictures of their work. It was a wonderful way for them to show their work and also display their work in an anonymous fashion (whilst having some "graffiti" fun on their lackluster desks. Kids with EXPO markers, who knew?!).
While technology is important, it's what we do with it that truly matters. Muhammad Yunus 
I realized that their participation could improve as long as I provided an outlet where students felt safe to share. I loved saving their responses and ultimately improving the lesson the following day.


I was fortunate to work with a group of students who not only were fascinated by the new tools but also their willingness to let me use them as my technology guinea pigs. Luckily, 90% of them passed their AP Statistics exam so I had some piggies who didn't waste too much time rolling around in the technology mud.

Interested in my statistical materials? Check out the lesson outline below!
Lesson Outline:
Objective: Students will be able to utilize a chi-squared significance test to determine if using your "gut" is more advantageous in a game of rock-paper-scissors.

Materials: The student materials will allow you to "Force Copy" what I created so that you have your own version.