Wednesday, January 24, 2018

"Spreading" the Word

For this entry, I would like to "spread" the word about utilizing Google Sheets in any math course that has students measuring data. For me, it was in my Statistics course. It's a powerful tool that not just allows students to enter data but to analyze it in a way that communicates a story. In Statistics, my biggest push for students was to reach beyond the numbers and include some juicy context in their solutions.

If a student shared out an answer of "10" with eagerness, I would give a warm smile and then probe his answer...

"10? Do you mean 10 squirrels? 10 cakes? 10 Jacobs? What's the 10 mean?!" 


I would get a pause from, let's call the student Jacob, and would encourage a more exact answer that is more meaningful. A number is meaningless without context to give it meaning. 

I created this lesson for an AP Statistics course to review not only Chi-Squared Goodness of Fit tests, but also as an introduction into Google Sheets. If you're just wanting the Google Sheets, feel free to snag just that!

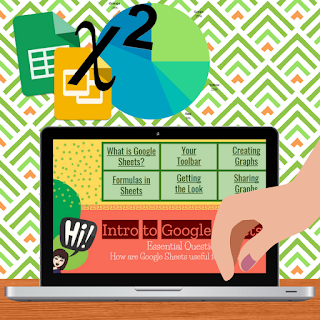
Lesson: Intro to Google Sheets

Essential Question: 

How can I utilize Google Sheets to create a meaningful analysis of data?

Materials:

I Do (sorta...not really): This lesson involves students in every phase.

Begin class with students filling out a Google Form so that you can use real data in the activity. While they're filling out their answers, start this absolutely hilarious video clip from "That 70's Show" where a father and son are having a brief...misunderstanding?...of Statistics. Feel free to emphasize the importance of communication in any math course. 

We Do: 

When you're ready, share the "Responses" sheet from the Form with students so that everyone gets a copy using Google Classroom or by changing the sheet URL to ".../copy" instead of ".../edit". Students will open the "Google Sheets 101" reference guide. Walk through the following with students:

  1. Creating a graphical display (pie chart, histogram, bar chart)
  2. Calculating summary statistics (average, median, standard deviation, quartiles, min, and max)
  3. Apply conditional formatting to highlight desired values
  4. Apply alternating colors so that the rows are more distinct (plus, who doesn't like a splash of color in their spreadsheets?

You Do: 

Provide each student with one bag of snack-sized Skittles. 
  1. Students will pour out their bag, organize by color, and then record their counts on a new tab on the same Google Sheet. 
  2. Share "Statistical Rainbow" with the students via Google Classroom where "all students can edit". This activity is a collaborative so that students can comment on other's slides when they are finished adding their own. 
  3. Students will create two slides (which are templates already made).
  4. Click [Present] when you are ready to go over it as a class! Add comments to their slides later.

Other resources I used:


  • Canva to make the backgrounds for my Google Slides. Use the 16:9 dimensions in Canva to make sure it fits perfectly!!

Sunday, January 21, 2018

Cracking the Digital Code


Creating lessons and activities with the 21st century 4C's can be an endeavor when balancing the curriculum act. What can be more tasking, is when technology is being pushed to be implemented without guidance.

My friend Lydia encouraged me to give "Tasks Before Apps" written by Monica Burns who emphasizes that before we can successfully integrate a piece of technology, we must consider...
"What is the task? What are our expectations for the learners in our classroom? How will we help them explore the content we are charged with teaching?...What would I like students to accomplish today?"
I'd like to share an activity that I helped create with the instructional technology team in my district. I was fortunate to share these materials at our District Wide Day to secondary teachers and it's been catching on! The best part? It's helpful for ALL content areas - not just mathematics.

After attending the Digital Summit (shoutout to Matt Miller for hosting!!), it encouraged me to share materials with others beyond my district.


Title: Digital BreakoutEDU

Description: Students work in groups of 3-4 to enter in codes (or answers) from a clue on a Google Sheet. Students can receive the codes in MANY ways:
  • On a printed handout 
  • On a task card
  • Scanned through a QR code
  • Some multiple choice on a Google Slide 
  • Perhaps a keyword given at the end of watching a video through EdPuzzle
Students enter in the code on the Google Sheet, and if it's correct, the sheet will provide them with the "next step" or clue to solve. If the code is incorrect, the Google Sheet won't change and will encourage them to try again.


What I LOVE about this type of activity:


  • Allows students to self-assess so that you can focus on supporting students who are struggling.
  • Encourages students to utilize error analysis when the code in incorrect. 
  • They must communicate with each other about the questions and dissect their thinking to help all team members understand their processing.
  • If they want to breakup the questions/clues, students must collaborate with each other to "beat" the clock.
  • Utilize critical thinking skills to answer clues correctly and efficiently. Clues can be riddles and even involve exploring various website sources. 
  • Encourage students to get creative and make the "clues" for you! They can choose from a variety of technology tools or on paper. When they share their questions with you, you can build code-breaker Google Sheet.

Interested in some materials?? Check it out below! 


Tuesday, January 2, 2018

Pop goes the Corn?

Modeling real-world data is an extremely beneficial skill for students to embrace in any math course, whether they're in elementary or secondary school. I'm a firm believer in the 5E Lesson model for mathematics. Through my years in the classroom, I've found success in students exploring math through patterns and making connections themselves - especially when you involve food of any kind.

In Algebra 2, I was able to introduce Quadratic Functions with the help of the activity below. For me, students have the hardest time answering the most simple question in math...

When will I ever use this in real life?!

Although popcorn may not be able to answer the question to the fullest extent, I found this to be an engaging lesson where students were surprised about this particular quadratic application.

Topic: Introduction to Quadratic Functions

Essential Question: What are the characteristics of Quadratic Functions?

Materials:
  • Padlet
  • Student Notes link - 1 per Student
  • Mini-Bag of Popcorn - 1 per Student
  • TI-84 Calculator Steps link - 1 per Group
  • 1 device per group (Chromebook, iPad, phone)
  • Graphing Calculator - 1 per student (recommended)
  • Desmos Online Calculator link - teacher only

Teacher Notes (using the 5E Model)

DAY BEFORE LESSON: Distribute one mini-bag of popcorn per student. Assign each student a different time interval and tell them to only pop their corn for this length: 0 sec, 20 sec, 40 sec, 60, 80, 100, 120, 140, 160. (Yes, you'll have multiple students with the same time.)

Engage: 

  1. Break students into groups of 3-4 using any method you'd like, and distribute one Calculator Steps sheet to each group so they can follow along.
  2. Have students go to the Padlet and answer the "Entrance Ticket" question before you begin.
  3. Encourage each group to explain their answer before beginning.
  • Why do you think...
  • Could you expand on...
  • Defend your choice of function...

Explore:

  1. Open the Desmos Calculator and ask students to share their delicious data from the previous night. (Click on the [Best Fit Folder] to create the best-fit quadratic)
  2. Students go back to the Padlet and answer Check #1 with their team. Have a team captain share their group's answer.
  3. The Class Data may not show a relationship yet. Encourage students to brainstorm why the scatterplot may not have a pattern yet. (Sample answer: different microwaves strengths/watts)

Explain:

  1. Hand out "Student Notes" sheet to each student. Ask each student to create a scatterplot based on the data. 
  2. Discuss why a quadratic would make the most sense for this situation.
  3. Have students enter in the data in their graphing calculator using the "Calculator Steps" hand out for support.
  4. Have students create the best-fit Quadratic model for their data and write the equation on their paper.
  5. As a team, have them make a prediction about how many kernels will be popped after 72 seconds. 
  6. Walk students through finding the optimal time and amount of good kernels using their calculator. Ask them to interpret the maximum in the context of this situation. 
  7. Students go back to the Padlet and answer Check #2 as a team. Each group can share out after.
  8. Stress that students utilize the vocabulary when sharing out their thinking: maximum, vertex, minimum, concave down, symmetry, etc.
Elaborate:
  1. Have each team answer Example 1 together and respond on their Padlet for their final conclusion.
  2. Ask students what other situations could involve quadratics. (Bonus points if it's food related...haha)

Evaluate:

  1. Post a question on your screen and have EVERY students put their answer on the Padlet as a conclusion.