Friday, February 23, 2018

Taking a Chance!


Taking a chance on lessons can bring about anxiety...even more so when it's a concept that students struggle with based on your experience. This is how I felt constantly when teaching probability.

Probability is not just the science of chance but also the science of overthinking - at least in my students' eyes. They could understand visually what was occurring, but throw in expected value, standard deviations, random variables, and the eyes begin to aggrandize.

Instead of fighting the uphill battle of "why use these formulas" and the "why did you subtract from 1?" questions, I chose a different approach and created an activity going back to the probability basics - throwing some die around and making some "money".
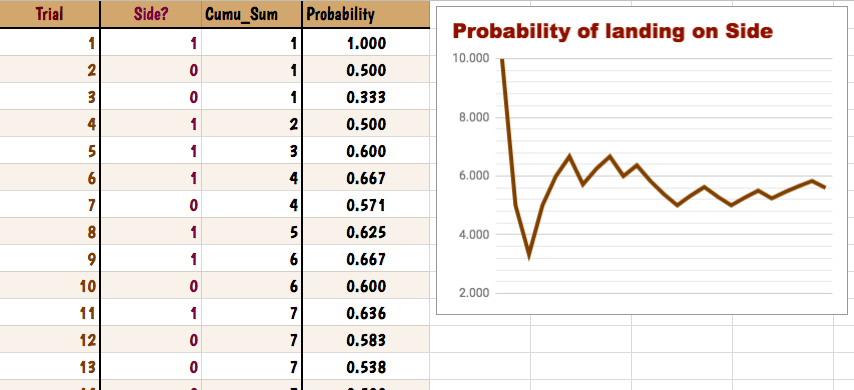
Sample Student Work

Activity: Bunko! 

Rules of the Game: Bunko is a game of 3 colored die. Based on what the students roll, you could receive "money". Assume that the die are fair.
  • If you roll the dice and end up with exactly one die showing a “1”, you win $1.00.
  • If exactly two dice show a “1”, you win $2.00.
  • If all three dice show a “1”, you win $21.00.
  • If all three dice show the same number (any number from 2 to 6) you win $5.00.
  • Any other outcome results in $0.00
Materials:
  • Activity: Bunko - Google Sheet (1 per student)
  • Activity: Bunko - Google Slides (1 per student)
  • Use this handout if your devices are limited (1 per student)
Concepts Addressed:
  • Expected Value/weighted averages
  • Combining Random Variables (multiple games)
  • Law of Large Numbers
Student Directions:
  1. Play 30 rounds of Bunko, recording your answers on the Google Sheet.
  2. Determine how much money you would win and record it. Watch your counts begin to fill in!
  3. Open the Google Slides and begin answering your questions.
  4. Gather all the CLASS data and enter that on your 2nd Tab. You will watch the class counts fill in!
  5. Create a graphical display of the class data for your Google Slides.
  6. Go to the Google Slides and answer the remaining questions with a partner.
Teacher Prep: Assign the Google Sheet and Google Slides through Google Classroom where "each student gets a copy."
Student's Google Slides! Don't have Google Classroom? Change the link from ".../edit" to ".../copy" and share it with them.

TakeTake-Aways:
Even though throwing dice can seem trivial, students surprised me by getting so excited! They grasped the concepts at a deeper level and performed stronger on their quiz. Perhaps sharing candy for students who had the most amount of money, least amount of money, and which student had the most significant counts??

At the end, they would want to play more games and determine further probabilities! I used this idea and created a probability game day, where they gathered the experimental probabilities and calculated the theoretical probabilities at home. 

Possible Extension for AP Students: Have students run a chi-squared goodness of fit to determine if their individual data was significant using the theoretical probabilities they made on the handout.

Overall, I was thrilled to take a chance and have the students play a game rather than going through additional examples from their textbook. They were more engaged, required to think critically and make connections, and most importantly, they developed a stronger foundation of probability that made the rest of the unit smoother.


Monday, February 19, 2018

"Transform" your Mind to "Transform" your Students

Algebra 2 can "stretch" the student's brains, because it truly extends what they've seen in new ways. I believe that this course has new topics that students haven't seen, but much can be built on their foundation from Algebra 1 with the help of inquiry-based strategies.

Transformed functions showcased in the Olympics
Transforming functions has a huge impact in the real world, because let's face it, how often do you see a Parent Function staring at you on a day-to-day basis? (Yes, it's okay if you said never...) However, once you transform them using a variety of operations, you've created something incredibly useful and underrated in classrooms today.

I wanted to share this lesson involving inquiry-based instruction that depends on student's to explore the various rules and see them in action using Desmos.

"Millions saw the apple fall, but Newton asked WHY!" -Bernard Baruch


Check out this Desmos Teacher Activity that I created! If you haven't used Desmos before, I highly recommend it! It allows students to explore various cases in mathematics within seconds. Students can make connections instantly and feel free to investigate freely.

In the Desmos Teacher Activities, you can:

Teacher Options
  1. Select your own "Pacing." This is especially helpful for those courses where chunking is crucial to student success.
  2. Select the "Pause" to make connections as a class and bring the group together for a quick formative assessment.
  3. Select "Anonymize" to help students share their answers in a stress-free environment. 
Screenshot from a Statistics Desmos
Activity where they were asked
to create a line of best fit.
While you're running the activity, you can determine if students have answered all the questions and leaves you free to assist students as necessary. The grayed-boxes in the picture would help be assist students that are struggling and need additional support with questions or encourage them to work with their team to brainstorm.

I've included some screenshots of previous activities that I've run in my Statistics course as well. The picture below shows my students creating what they believe is the "best-fit" line before we discover how to actually determine the real best-fit.

I can't stress how important it is for students to make predictions first before revealing anything. I couldn't count how often my students surprised me with their intuition and mathematical connections before I shared the "real" answer.

Screenshot of Anonymized Students
and students' Progress
The hardest part of Inquiry-Based Instruction that I've found is allowing your students the freedom to explore and knowing that they WILL discover it on their own without you. I get very tempted to step in, show them the steps, and then have them practice. However, I PROMISE, they will have a firmer grasp if you give them the chance.

Inquiry Based Benefits: My Favorite 5!


  1. Nurture students' passions and natural curiosity
  2. Increases engagement by relating the content to them personally.
  3. Teaches perseverance through tough problems
  4. Encourages students to take responsibility for their own learning.
  5. Allows students to ask deeper questions.

Interested in learning more about Inquiry-Based Instruction? Wanting to become a teacher?!

Consider the UTeach Program and its sister programs across the United Stated. I am an alumni of the Teach North Texas program at the University of North Texas.


Sunday, February 11, 2018

Pieces of my Heart

Check out Desmos Art for more!
For my final post in the Mathematics Series, I want to share one of my favorite projects. (Don't worry...just taking a break from the math to begin a new series)

Piecewise functions can be drag and cause students to break into pieces themselves. To me, piecewise functions can be the most useful ones in all mathematics. I usually explain to students that these are thieves - stealing pieces of functions that it needs or finds useful.

"To me, mathematics, computer science, and the arts are insanely related. They're all creative expressions." ~Sebastian Thrun


One of the BEST projects that I've done for my students is creating a "piece" of art using only piecewise functions. Not only do I get to see my students creativity come to life, but I also can determine their level of understanding of this topic. The project requires...

  • Knowledge of Parent Functions
  • Knowledge of Domain and Range
  • Knowledge of restrictions that apply to different functions
  • How to utilize inequalities for shading
Instead of focusing on graphing these functions and writing their equations on a worksheet, students are practicing these skills digitally but also engaging in other digital skills. Students loved coming to class to create a picture using maths. They were constantly surprised about how maths could fit into the pictures they were creating. Students were driven to reach beyond functions we've seen and create new ones (circles, ellipses, and trigonometric function). At the end, students shared their work and voted on their favorites to be featured on our class Twitter page.

Project: Pieces of Art


Directions: 


  1. Students work with a partner to complete the activity in Desmos. This will help them discover and learn Piecewise Functions. This activity walks them through how to create different functions using Desmos.
  2. The last slide of the activity provides a link to the Desmos website for students to get started with their creation.
  3. A rubric is included below that uses Google Docs (paperless we go!).

👍TIP: Have students create a Desmos Account! This way they can save their work each day and then email you the picture at the end of the project!


👍TIP: Use a Google Form for student submissions. Then you have all the links in one place and your email is less flooded!


Materials:

Friday, February 9, 2018

Chocolate-y stress in Math

After attending TCEA in Austin recently, I wanted to create a post about going digital in the math classroom, thanks to Amanda! In this post, I'd like to focus on the stress and anxiety that math can induce in students. Jo Boaler, an amazing educator who focuses on mindsets in mathematics, stresses (pun intended) that...

"When students get the idea they cannot do math, they often maintain a negative relationship with mathematics throughout the rest of their lives...the idea that math is a "gift" is responsible for much of the widespread math failure in the world."


My question is, so how can we encourage students to maintain a growth mindset in maths and how to create a class environment that is geared towards helping them achieve this? One way that I hope to answer this is share some lessons that had students arrive at different answers and that our final conclusion in class was THAT THIS IS OKAY! Jo wants students to see the creative and interpretive nature of mathematics, and I think an example lesson will help.

One of my favorite lesson styles is utilizing the 5E lesson model, where inquiry is at the heart of lesson. I think this is one of the best ways to encourage all students to interact with math and alleviates some of the apprehension students face. The lesson below will outline this style and materials are included at the very bottom if you're interested! You will need a Hershey Kiss for every student (why not help relieve stress in math by using a little chocolate???)

Title: Chocolate-y Odds

Essential Question: How can I determine the odds of a Hershey Kiss landing on it's side?

Audience: Statistics, Probability, Math Models and Applications, Geometry

Engage:


  1. Break students into group of 2-3 people. 
  2. Have students make predictions about what the odds are of a Hershey Kiss landing on it's side. Record their answers on a Mentimeter to gather the their thoughts quicker. 
  3. Sample Mentimeter
  4. Have students share out how they made their prediction. Consider how the Hershey Kiss is shaped and compare it to a coin.

Explore:

  1. Provide students with this Google Sheet so that they can record their data. Use a "1" if the Kiss lands on it's side and a "0" if it's on it's bottom. This can be done with their group. 
  2. Have students calculate the Cumulative Sum using Google Sheets. Example: if I want to add Cell B2 to B4, type "=sum(B2:B4)". If students don't want to type it, they can click and drag all the cells they want.
An Example of a final product!

  1. Have students calculate the probabilities with each step by dividing the cumulative sum by the trial number. Example: "=C3/C1" in the cell
  2. TIP: Google Sheets will start to PREDICT the formula if you keep using it over and over again! Simply click the "blue box" next to the cell and drag it all the way down! 
    The "blue box" is in the lower RIGHT corner
  3. Finally, have the students create a LINE GRAPH of their probabilities. Steps are included on the Google Sheet if you have students finish the sums early.

Explanation:

  1. Have students open the Google Slides. TIP: Share the Slides in Google Classroom by choosing "Students can Edit". 
    "Team Response" Slide
  2. Students to add the slide "Team Response" to the presentation. 
  3. Each partner/group will add their Probabilities Line Graph to the Google Slide and answer the questions with their team based on their graph.
  4. If students are finished early, have them go to another group's slide and provide some feedback, like a Bitmoji
  5. Click [Present] and go through each group's line graph. As you look through each one, have each team write down some observations on a Mentimeter. All students deserve a VOICE! We are in 2018, people!
  6. Choose Open-Ended on Mentimeter!
  7. Hopefully one of the observations between all the graphs is that the more times students tossed the Kiss, the line graph gets closer to a number!

CONGRATS, you've introduced the Law of Large Numbers/Kisses.

Elaborate:

  1. Have students interpret what it means when a coin is "50/50" using the Law of Large Numbers.
  2. Provide the example of the coin again. Ask, "If I keep getting tails over and over again, am I MORE LIKELY to get heads?" 
  3. Introduce the idea of independence - each toss doesn't affect the next one. The odds are ALWAYS 50/50 with each toss.
  4. Introduce that we are never "due" to get an outcome. This is called the Law of Averages and IS NOT TRUE.

Evaluate: 

Students find an object at home and toss it (not breakable, duh!) and create another line graph and share it on another Google Slides presentation. Open these up the next day and students can share their findings and how the Law of Large Numbers relates.

Extra Materials:


  • Teaching AP Statistics or Science: Designing Chocolate (Google Slides) - Experimental Design
    • TIP: If you're sharing in Google Classroom, choose "Students can Edit" so that everyone is on the same slides.
    • This is PERFECT if you teach AP Statistics to help students understand how to set up a proper experimental design.
  • Aren't 1:1 yet or have the devices you need? Here is a worksheet using the TI-84 Calculator instead!
  • Teaching AP Statistics? Use this data again to have students create confidence intervals! Use this worksheet if you'd like as a resource! I haven't made this digital...yet ;)

Interested in making Math more digital? Check out my Session Notes from the TCEA conference in Austin, Texas.