Showing posts with label Canva. Show all posts

Tuesday, June 5, 2018

"Hype" Up your Docs!

I've always been interested in the transforming powers that technology can provide. It can allow
students to learn at their own pace or even reach beyond the classroom walls. Students have the advantage to work with another student across the room without shouting or even across the world. The big question we ask ourselves is...How is this possible? How much time does this take to set up? What happens if they don't learn what they are "suppose to"?

I can answer honestly, I was worried as well. I was nervous to loosen the reigns, to let them explore at their own pace, to find the answers without me showing them myself.

So what changed?! - Welcome to Hyperdocs!


A Hyperdoc is a transformative, innovative Google Doc/Slide that is student-driven. Think of this as doing the guiding for you to free you up to assist students individually. You don't need to send them links and walk them through each step - let the Hyperdoc do it!

According to the Hyperdoc Handbook, before you start jumping in (or at least dipping your toe in), you should consider the following:

  1. Consider your OBJECTIVE -- What do you want students to learn?
  2. Select your Learning Cycle -- How do you want students to learn it?
  3. Select your packaging -- How can this be presented?
  4. Build a workflow -- Will students know what to do?
  5. Design your Hyperdoc! -- Do you want a Google Doc or Slides?
What transforms a Google Doc to a Hyperdoc?! Ask yourself these quick questions.

  1. Is it interactive or static?
  2. Is it student-driven or you-driven?
  3. Is it personalized or will each student give the same answer/product?
  4. Does it encourage collaboration or is it individual work?
Biology Example (Google Slides)
Creation can be daunting. The "where to start" or the "how do you know what to include"? This is where you, yes YOU, come into play. Grab your content and go beyond what you see. Is there a quick video they could watch? Is there a way for students to collaborate on the notes? Can students create something to show their learning? Feeling stuck - no worries!

Below I have some resources that I have found helpful. Some include templates, example lessons, helpful sites, and even some tutorial guides to help you get started. 

Tutorial Guides/Sites:

Favorite Tech Tools to transform your Doc/Slides:

  1. Flipgrid - create a topic where all students can create a video response.
  2. Padlet - create a digital post-it board where students can type, draw, insert links/pics, add video notes, and much more.
  3. EdPuzzle - create an interactive video with questions at any point!
  4. Google Forms - create a survey or quiz where data can be instantly analyzed.
  5. ClassHook - find educational videos ready to use for any content to get that "hook".
  6. InsertLearning - a Chrome Extension that makes any website interactive.

Content Examples:

Tuesday, March 27, 2018

Challenging our PD!

After reading Chapter 8 of Carl Hooker's Mobile Learning Mindset (for coaches), I had lots of ideas for our professional development - mainly interactive learning challenges.

These challenges involve "no direct training on actual technology and apps" but "every challenge requires technology" (82). Teachers are organized into teams and there are various challenges throughout the day/conference/time. Teams all have a teacher who is considered "high tech" as well. The example Carl provided had 10 TOTAL challenges that teams could pick from varying in tasks: create..., listen..., draw..., eat..., etc. I think it would be cool to have teachers submit their challenges either on a Padlet or even through a Google Form (that way all the links are in one spreadsheet). His argument is that if we desire our teachers to create a student-centered lesson, why not model this in our professional development?! 

Some concerns that I will address with my team are:

  1. How can we share new, up-coming apps to teachers?
  2. How can we support teachers who would like the one-on-one tutorial?
  3. How can we empower our teachers to create something similar if they believe it "takes too long to make"?
  4. Could we run these challenges (one per semester) for teachers to earn PD hours?
  5. Could we have teachers pair with other campuses? Create a Google Classroom for all these challenges?
Created in Canva
One of my favorite parts of the book that caused me to pause and reflect was The Learning Pyramid. It made me breakdown previous sessions that I've provided and I came to the conclusion that a lot of my sessions were more passive - OH NO!! I think when we create PD that is more passive, teachers may not see the actual value of the technology or ideas that we present. We aren't providing them time to play, create, and brainstorm with their peers about what we're showing them! How can we expect them use this technology effectively if we don't provide them this time?!?

Based on Chapter 9-10, I have some additional thoughts moving forward, especially since our Elementary schools will be getting class sets.
  • Provide opportunities for parent education/parent nights to address concerns
  • Promote the learning of every technology staff member - how can I continue growing in my coaching skills and my technology competence?
  • Identify staff members that have a desire to incorporate technology meaningfully by meeting with admin and instructional coaches
  • Create campus-specific PD opportunities ('Appy Hours)
  • Continue using FutureMe to send monthly goals and reflection questions throughout the year.

My BIGGEST take-away from this book: MODEL WHAT YOU PREACH!


My #BookSnaps


Wednesday, January 24, 2018

"Spreading" the Word

For this entry, I would like to "spread" the word about utilizing Google Sheets in any math course that has students measuring data. For me, it was in my Statistics course. It's a powerful tool that not just allows students to enter data but to analyze it in a way that communicates a story. In Statistics, my biggest push for students was to reach beyond the numbers and include some juicy context in their solutions.

If a student shared out an answer of "10" with eagerness, I would give a warm smile and then probe his answer...

"10? Do you mean 10 squirrels? 10 cakes? 10 Jacobs? What's the 10 mean?!" 


I would get a pause from, let's call the student Jacob, and would encourage a more exact answer that is more meaningful. A number is meaningless without context to give it meaning. 

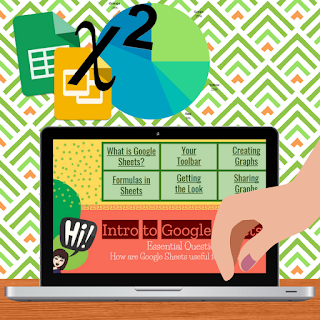
I created this lesson for an AP Statistics course to review not only Chi-Squared Goodness of Fit tests, but also as an introduction into Google Sheets. If you're just wanting the Google Sheets, feel free to snag just that!

Lesson: Intro to Google Sheets

Essential Question: 

How can I utilize Google Sheets to create a meaningful analysis of data?

Materials:

I Do (sorta...not really): This lesson involves students in every phase.

Begin class with students filling out a Google Form so that you can use real data in the activity. While they're filling out their answers, start this absolutely hilarious video clip from "That 70's Show" where a father and son are having a brief...misunderstanding?...of Statistics. Feel free to emphasize the importance of communication in any math course. 

We Do: 

When you're ready, share the "Responses" sheet from the Form with students so that everyone gets a copy using Google Classroom or by changing the sheet URL to ".../copy" instead of ".../edit". Students will open the "Google Sheets 101" reference guide. Walk through the following with students:

  1. Creating a graphical display (pie chart, histogram, bar chart)
  2. Calculating summary statistics (average, median, standard deviation, quartiles, min, and max)
  3. Apply conditional formatting to highlight desired values
  4. Apply alternating colors so that the rows are more distinct (plus, who doesn't like a splash of color in their spreadsheets?

You Do: 

Provide each student with one bag of snack-sized Skittles. 
  1. Students will pour out their bag, organize by color, and then record their counts on a new tab on the same Google Sheet. 
  2. Share "Statistical Rainbow" with the students via Google Classroom where "all students can edit". This activity is a collaborative so that students can comment on other's slides when they are finished adding their own. 
  3. Students will create two slides (which are templates already made).
  4. Click [Present] when you are ready to go over it as a class! Add comments to their slides later.

Other resources I used:


  • Canva to make the backgrounds for my Google Slides. Use the 16:9 dimensions in Canva to make sure it fits perfectly!!