Showing posts with label Chromebooks. Show all posts

Friday, December 4, 2020

Flipping Out over Math!

With the dawn of virtual learning, it's been increasingly difficult to create engaging experiences for my students, especially in math. This year, I've taken on a dual role of digital coaching and instructing PreAP Algebra 2. What was I thinking?! 

I knew this year would offer challenges, not only in terms of rethinking instructional best practices, but also utilizing technology in a responsible way. I wanted to be "on the ground", so to speak, with the staff, but also find ways to help support them.
At our campus, we have shifted to a block schedule, with 90 minute class periods. That's a lot of Zoom, you might say! Isn't that too much for students?! 

While a 90 minutes block has it's challenges, especially for teachers with virtual learners, it also has the potential for deeper thinking. This year, I've decided to try something that I've only been reading about - flipping my instruction.

What can that look like?

  1. 📽️Record and edit my content video using WeVideo. 
  2. 💻Embed in Edpuzzle with questions to guide thinking and encourage predictions.
  3. 💜Utilize the beginning of class as a "check in" using Google Forms (approx 10 min)
    1. Instant data to provide quick feedback before diving deeper into content
    2. A private space for students to share how they are doing
    3. A fun space to get to know your students
    4. Drop in a "this or that" to increase fun discussions
  4. 📊Desmos Activities to expand thinking and build connections (approx 35 min)
    1. Show videos and ask for predictions
    2. Use sliders to build pattern recognition
    3. Utilize multiple choice, but add "Explain your thinking" option.
    4. Use Starter Screens as an exit ticket
  5. ⏰Asynchronous Time with GoFormative (approx 45 minutes)
    1. Students work on exercises at their own pace, seeking help when needed.
    2. Provide students CHOICE: Stay on Zoom and treat like a Q&A, go to a virtual Breakout Room to work with a small group, or log off to de-Zoom, but still accomplish the task.
    3. Give instantly feedback while students are working. Provide QUESTIONS not ANSWERS!

Samples:

Saturday, April 4, 2020

Remote Mathematicians

In this "new world" of remote learning, keeping students engaged in content can seem daunting. That feeling of not just sharing content, but making it easily accessible and engaging enough for students to stay connected, brings its challenges.
As a previous math teacher, it was tough enough helping students enjoy the content, so flexing the "creativity" muscle in the brain was a CONSTANT.

During this time, I thought I'd share my top 3 go-to strategies!

TIP #1: Encourage inquiry and self-discovery!


  • Geogebra: This site offers Classroom Resources from elementary up to college courses. Students can explore theorems, visualize multiple cases, and then easily develop their proof. Geogebra even has built in activities with self-checks. Follow Tim or Steve on Twitter to see their creations.
  • Desmos: Teachers can create a FREE account and send activities to their students. Use one that's already made or create your own! Explore transformations and how variables can affect equations.
    • NEW UPDATE ALERT: Add a co-teacher!
    • NEW UPDATE ALERT: Send customized feedback to students.

TIP #2: Increase the open dialogue by using open tasks!

  • Which One Doesn't Belong: 4 boxes...which one doesn't belong? The best part - there is a reason EVERY SINGLE ONE doesn't belong. Bring the discussion into math and allow students to see there isn't just "one answer." Do you have gifted students? Encourage them to create their own!
    • Bitmoji Image
    • Copy/paste a puzzle and use THESE SLIDES! Share it with students so everyone can edit the same file. 
    • Numbers Example (for Elementary up to High School)
  • Open Middle Math: One problem can completely replace a worksheet! Students not only practice, but must use logic and reasoning to finish the puzzle. Available for K-12 students!
    • PRO TIP: Share on a Google Slides or Keynote for students to respond. They can drop in recording to explain their thinking.
    • PRO TIP: Use master slides to create text and image placeholders for students.
  • PRO TIP: Attach an Open Middle or WODB problem to the "Focus" in a Flipgrid Topic. Ss can use the whiteboard mode to share their thinking with their peers! 

TIP #3: Using the tech in your tool belt!

  • Keynote (on the iPad): While it is similar to Google Slides, Keynote on the iPad takes the advantage! A fantastic mathematician and edtech enthusiast, Morgan Cave, on the team I work on got me into this app, and there is NO turning back! As an Apple Distinguish Educator, she's continuing to push outside the box for how Keynote can be used to explore all concepts.
  • Google Slides (for Chromebook): 
    • Use master slides to create template responses with placeholders.
    • Ss can drop in pictures, links, videos, text, animations, and MORE all in one place.
    • Collaboration feature for discussions or group work is PERFECT! With the editing history, no work is lost and students are help accountable for their contribution.
  • Google Sheets (for Chromebook): Check out these helpful resources and templates using the "ugly step sister" of the G-Suite family!
  • Math Learning Apps:
    • Digital manipulatives for the WIN!
    • 100% FREE!
    • Includes annotation feature! 
    • PRO TIP: Ss can screenshot their creation, and drop it in Seesaw or Keynote to add audio!
  • Flipgrid:
    • Whiteboard Mode = PERFECT for explaining work.
    • Drop in a video, picture, and/or links in the Focus for your Topic.
    • Students don't want others to see their face? Use Pixel Mode!
    • Check out their Disco Library for Topics ready to go!

Sunday, April 29, 2018

A "functional" Transformation

One of the biggest topics in a secondary mathematics class is function transformations (horizontal/vertical shift, compressions, stretches, etc.) Usually students will memorize the rules rather than understand the reasoning. I needed a way to enhance the lesson to allow students room to investigate these concepts and draw their own connections and conclusions - time to spice things up with technology!


Topic: Intro to Transformations


Essential Question: How can I transform ANY function?


Materials:


  • Desmos Activity - Make a copy if you'd like to make some adjustments! (link)
  • Student Notes - Google Slides (link) Click [Use Template] to make your own copy in your Google Drive.
  • 1 device per 2 students - I recommend a Chromebook/computer.
  • Recommendation: a Google Classroom to share the notes with each student.
Student Notes (Google Slides) Preview

Teacher Notes:

  1. Assign the notes in Google Classroom where each student gets a copy.
  2. Go to teacher.desmos.com. If you don't have one, create an account! I recommend with a Google Account to make the sign-in easier.
  3. Open the Desmos Activity (Intro to Transformations) above. 
  4. Click on the teal [Create Class Code]. This will need to be copied on Slide 1 in the Google Slides. This is how students will access the activity.
    Desmos Activity (Preview)
  5. Students will partner up and bring their computer/Chromebook. Each student can login so that everyone answers the activity questions and can take screenshots to add to their Google Slides for their notes.
  6. Encourage students to take their time exploring each transformation carefully. They may struggle understanding shifting left and right. I related it back to the distance formula - (x - 3) moves RIGHT 3, not LEFT. 
  7. The Exit Ticket/Reflection piece is on Flipgrid. Create a TOPIC in Flipgrid where students can respond.
  8. TIP: I created a topic for EACH UNIT in my class so that students could see how their questions and reasoning improved as the unit continued. 

My Reflection:

  • Since the remaining of the year (and future mathematics courses) depended on this lesson, I felt strongly about student exploring it on their own. I tried teaching the rules one year and it only set them up for failure later. 
  • I'm currently reading Shake Up Learning by the infamous Kasey Bell of Texas. In her first couple of chapters, she stresses the importance of integrating 21st century skills into as many lessons as possible - hence, shake things up! Students will be asked to analyze critically and shoving rules in their faces wasn't accomplishing this and was NOT preparing my students for their future careers. Careers where thinking on their own and creating their own connections would be a requirement.
  • One of my biggest fears with "shaking up their learning" is that my students won't learn the concepts "correctly". What if they misunderstand and I don't catch it?! In my mind, technology allows me to assess formatively more often, therefore I can check understanding frequently. When my concern of "learning incorrectly" snuck in to my mind, I forced myself to remember Jo Boaler - making mistakes is a learning opportunity. Even more so, making mistakes will make their brains grow. 


Tuesday, April 10, 2018

A "Random" Post?

What is "random?" What does it mean mathematically to be "random"? Ask any person to pick a "random" number, and you'd most likely discover a pattern...wait, what?!

In Statistics and Probability units, students think they understand how random events work. They think they are sincerely selecting random numbers when asked. Funnily enough, this concept can be quite vague. In a previous post, I shared a lesson to help students understand the Law of Large Numbers.

In this one, I want to share a lesson where students understand when they pick a "random" number, it truly is NOT random. My goal with this lesson was for students to discover this definition by using inquiry. Students discover patterns and come to the conclusion that we don't actually pick "random" numbers - quite hilarious when you watch their eyes enlarge at the end of the activity.

Why I used technology:


  • Students are engaged by using their own sense of intuition and curiosity. 
  • Google Sheets allows them to quickly graph the the class information and find averages without the hassle of too many steps.
  • Students log their observations on Google Slides, which they can reference later. 
  • All links and materials students will need are in one location - Google Classroom on the Slides.
  • Students choose which graph they want to use and explain their choice.
  • Teacher can access all students Slides in Google Classroom and provide comments to students work without taking extra materials home.
  • Students create their own examples instead of being handed them. To me, this allows the learning to be their responsibility.
  • By sharing out definitions on a Padlet, students can share their thinking using various methods (text, picture, GIF, voice note, hand-drawn picture). 
  • Students vote on their favorite definitions to develop the best one.
  • Ultimately, this enabled the lesson to be student-centered!!

Topic: Simple Random Samples

Essential Question: How can I create a sample of items that is truly random?


Materials:

  • Google Slides - Student Notes (1 per student)
  • Google Sheet - Student Notes (1 per student)
  • Google Doc - Federalist Paper word breakdown (1 for all classes)
  • Padlet - create a padlet using the "Wall"style.
  • Forensic Linguistic Article (link)
  • Simple Random Sample Site (link)

Lesson Outline:

  1. Warm Up: Students read a quick article about forensic linguistics using the link on Slide 1. They write what was surprising to them and how math was helpful in discovering the truth.
  2. Activity: What is your Pseudonym? Students investigate the Federalist Papers to show how finding the average word length can determine authors. In this activity, students select their OWN 5 words they believe would best help them find the true average word length of the passage.
  3. Students gather all the class data on the Google Sheet. Each student creates a graphical display of the data.
  4. Now students use their calculator to select the 5 random words and calculate the average word length. Similarly, students gather all the class data and begin to compare the two rounds.
  5. Expand: Students expand on their knowledge by investigating what a "simple random" sample is and create their own definitions to share on a class Padlet. 
  6. Encourage students to vote on the definitions they believe are the best. Ask students to find pictures online as well or draw something they can take a picture of and post. 
  7. IDEA: Have students grab a partner and submit one answer per team. If you want to keep their names, the definition that the class likes the most could win some prize?
  8. Exit Ticket: As a closer, students fill out a Frayer Model with the formal definition, a picture, an example, and a non-example.

Take-Aways:

  • When students developed their own definition, they could remember the concept at a deeper level throughout all the units following.
  • Gather their examples (from Google Classroom) for the next day as a practice activity. Have the students organize the examples into 2 categories (Good/Bad) to see what they've learned. Discuss examples that students had difficulty classifying.
  • Introduce other sampling methods as a follow-up activity. Students can compare and contrast the various methods and when to use each one.
  • Students can find articles where simple random sampling has been used or why it was not used. 
    • Check out the Mythbusters clip below where they check if yawning is actually contagious! Did Adam and Jaime use a Simple Random for their experiment?!


Thursday, March 8, 2018

So how many licks...?

Everyone knows the famous question that's plagued children and adults for millenia...

How many licks does it take to get to the tootsie center of a Tootsie Pop?


One of my absolute favorite lessons in AP Statistics was the Tootsie Pop Lab. This lab emphasizes how to estimate the ACTUAL average amount of licks it takes to get to the center. Will this question ever be answered!? Non-Statisticians would tell you "nah", but the real Statisticians would use inference mathematics. In this realm, we can get pretty close to the actual answer by providing a range of possible answers that could be true - what Statisticians call a Confidence Interval.  

A big idea running through the veins of Statistics is the idea of an unknown parameter - the ACTUAL population value. Example questions we could answer that have these unknown parameters would be...

  1. What proportion of the world is covered in water?
  2. What is the average life expectancy in the United States?
  3. What is the average number of books teens read?

Clearly they were into it!
Clearly, it would be a challenge to find the ACTUAL percentage of the world covered in water or the actual average life expectancy, but we can get reallllllly close by taking sample measurements and drawing conclusions from there - i.e. finding a statistic! 

In Statistics, it's about getting on the dart board - not the bull's eye!


This lab teaches students this very idea! We may never really know the answer, and THAT'S OKAY! Using inference to draw conclusions is what mathematics can yield - and even better, we can provide plausible answers! It's a rare glimpse into the power and insight that only mathematics can provide. 

Activity: Tootsie Pop Lab

Essential Question: 

How can I estimate the true average amount of licks it takes to get to the center of a Tootsie Pop?

Materials:

  • Tootsie Pop Presentation - Google Slides (click Use Template for your own copy!)
  • Tootsie Pop Analysis - Padlet (click Remake if you want to use it!)
  • Student Notes - Google Sheet (click [Make a Copy] and now it's in your Drive!)
  • Flipgrid - create 1 topic in Flipgrid where students can post their reflection asnwers
Possible Student Google Sheet

Provide students with the directions about licking their lollipop and remind them to lick in the SAME SPOT. You'd be surprised how into it your students get. I recommend putting them in partners, especially if you have a student who doesn't like lollipops.

As students begin to find their center, have each student enter in their number of licks on the Google Sheet. I highly recommend using Google Classroom to help you share information with students. You'll be sharing the Sheet, Flipgrid, and Padlet with them.
Teacher Presentation (other slides included)

PRO TIP
: In Google Sheets, type "=" to get the formulas to work. For example, "=average(...)" and then students can select all the trials at once. It works similarly for the others.

Take-Aways:

  • The "homework" for the evening is not practice problems at all! It's all about reflecting on what they discovered in class. Students recalled previous information to see how it fits in to their new content.
  • Students LOVE candy (surprised about that?)
  • Students enjoyed working with REAL DATA! It's not made-up numbers from a textbook or internet. It was personal. They were the data.
  • Putting them in partners helped them find formulas in Google Sheets quickly and allowed them to process their ideas out loud.
  • Why I used Padlet: helps students collaborate all at once in an easy way. Students can add voice notes, drawings, text, links, and photos for everyone in the class to see. This allows students to express their learning in a variety of ways that best fits them.
  • Why I use Flipgrid: Students can post their reflection questions after the lessons and hopefully hear from other students. This way, students can respond to each others questions and really utilize peer feedback. This develops a community in the classroom, because we are all learning together.

Interested in the answer my students found? Check it out!

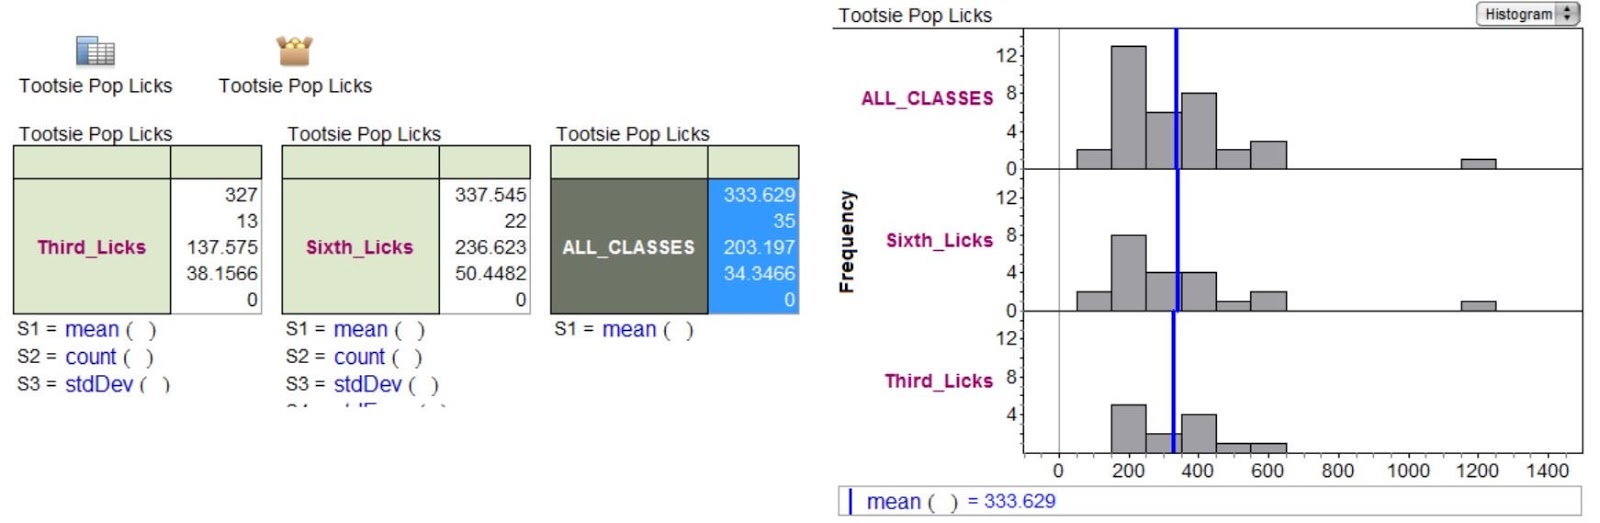
Before my district had Chromebooks for every student, I used Fathom to gather all of the data from my classes last year. Here is what we've discovered!

My students were really surprised that both classes had an average close to 330 licks.

Our Class Average amount of licks: 333.629 licks

My Class Data (2016)


Sunday, March 4, 2018

A New Mindset

In one of my book studies that I'm participating in, I'm forced to reconsider the way mathematics is approached in the classroom. Dr. Jo Boaler is a professor at Stanford University for Mathematics Education. Her passion involves helping math teachers ACTUALLY TEACH mathematics. She strives to encourage teachers to move away from "sit and get" styles to pattern-investigation methods.

"When textbooks introduce only the simplest version of an idea, students are denied the opportunity to learn what the idea really is." Dr. Jo Boaler from Stanford University


What I'm reading
She is breaking down the wall and suggesting new, innovative ways to improve EVERY student's success in maths. She does not support the idea that you have a "maths" brain. She explores various research studies that show any student can learn maths if taught using some of her strategies which can include:

  • Show examples and non-examples of definitions
  • Rethink homework assignments to be reflection based instead of problem based
  • Have students explore different methods and compare and contrast
  • To reinforce concepts, have students use the concepts in different ways
  • NO memorization - but utilize BOTH sides of the brain
  • REMOVE timed-testing and math facts

I know what you're thinking...how can I do this? How can students learn maths if I don't show them the best methods and those precious shortcuts?! 


One of my toughest lessons in Algebra was Completing the Square. Students didn't understand for one thing, why it was even called that! They couldn't remember "all the steps" and couldn't make a connection what was really happening. Students memorized the steps and continued on their year which eventually lead to a brain dump to make room for the next memorization event.

Jo discusses the idea of "compression" in our brains. She explains, "when you learn a new area of mathematics...it takes up a large space in your brain." Once you play with ideas and dig deep, you can "file" them away and "compress" them. My biggest "Ah-ha!" moment was when she states, "Notably, the brain can only compress concepts; it cannot compress rules and methods." 

This allowed me to re-create my lesson on Completing the Square utilizing Algebra Tiles to help students explore the concept and build their own connections. If you've never used Algebra Tiles, I HIGHLY recommend it.
Student Notes (Google Slides)
Students build the polynomial using the tiles to literally make a square and determine how many 1's would it take to "complete" it. Throughout the process, students are reflecting on their learning and creating their own solving steps. For the extension exercise (i.e. homework), they will discover the Quadratic Formula! WHAAAA?!!?! Additionally, they will respond on a Flipgrid about their learning.

Student Reflection assignment

Materials:


  • Notes: Complete the Square (1 copy for each student) - Google Slides
  • Khan Academy Video (already in slides)
  • Flipgrid: Create a Quadratics Topic for students to post their thinking
  • Bitmoji: Students add bitmojis on their exercises to show how they feel

My Take-Away: 

Every student felt successful learning this new method. I had students make connections to other topics (graphing quadratics using the vertex) and even preferred this method OVER factoring! I couldn't believe the positive energy that was occurring and for once, the students were the ones doing the thinking! I became a guide for the day and my students didn't feel the need to have 20 identical problems for homework. 


Questions you could ask them for reflection exercises (consider using Flipgrid):

  1. What kind of number for "b" makes completing the square easier? Explain your thinking.
  2. What do you think would happen if "a" is not 1?
  3. Do you think this method could work every single time? Defend your position.
  4. Is there a time that this method works better than another? Explain by creating your own example.
  5. Compare this method with factoring.